Stadium Capacity Utilization and Its Influence on In-Play Odds Shifts During Crowded Fixtures
Written by Taylor Brooks · Jul 17, 2026
Stadium Capacity Utilization and Its Influence on In-Play Odds Shifts During Crowded Fixtures
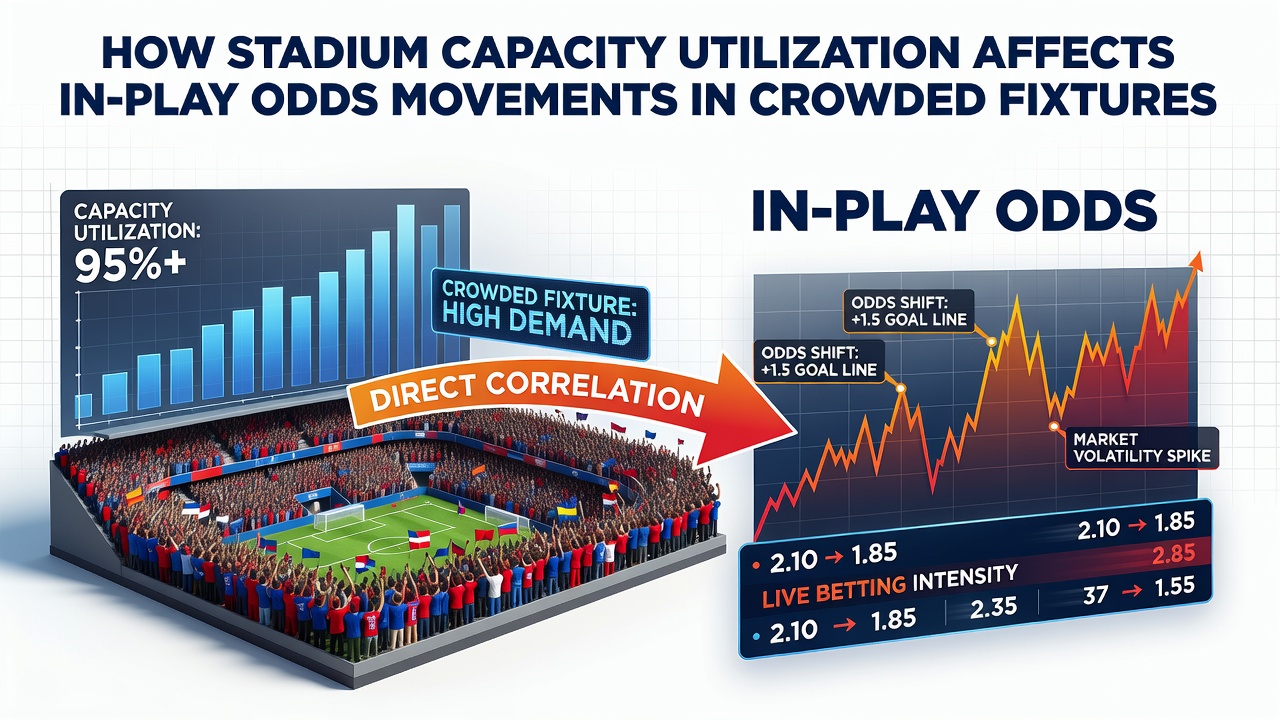
Stadium capacity utilization refers to the percentage of available seats filled during a match, and this metric correlates with measurable changes in live betting odds across multiple European and international leagues. Researchers tracking data from major competitions note that fixtures reaching 90 percent or higher occupancy often exhibit accelerated odds movements in the opening 15 minutes compared to games played before smaller crowds. The patterns emerge because full venues amplify home advantage factors through sustained noise levels that influence player decision-making and referee calls.
Core Factors Linking Occupancy to Live Market Activity
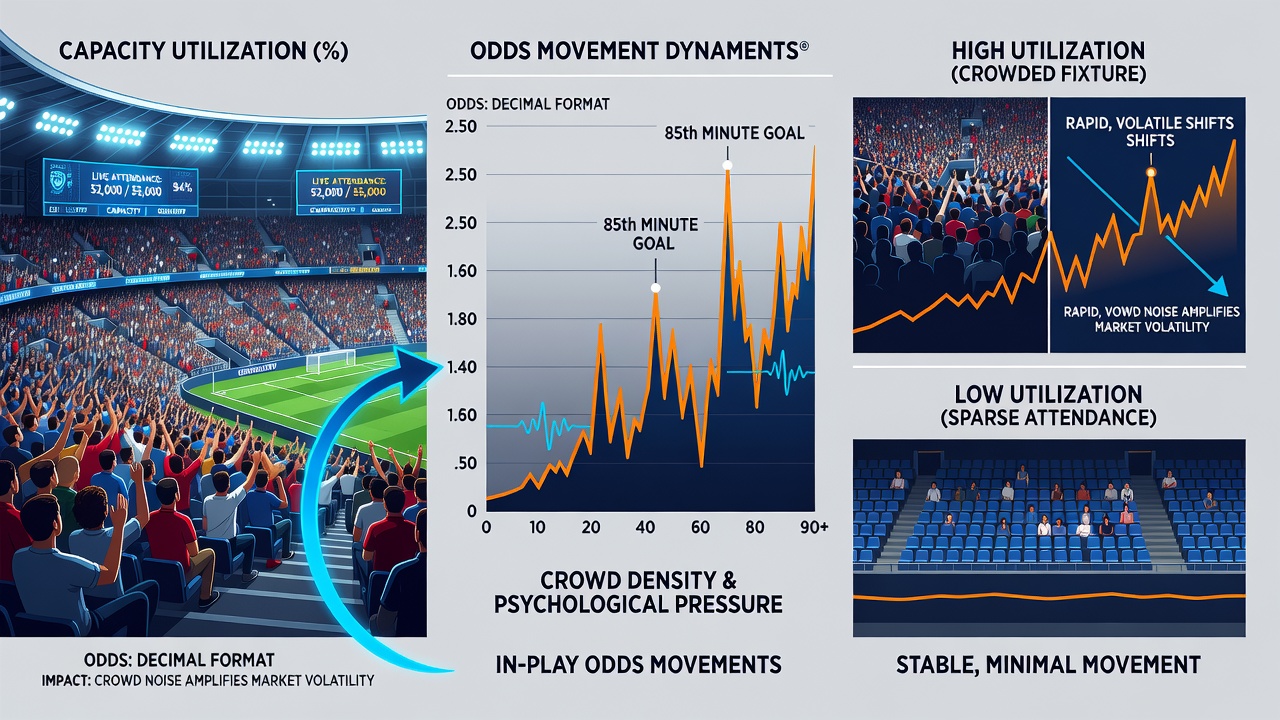
High utilization creates consistent pressure on visiting teams through continuous auditory interference which disrupts communication and concentration, and betting platforms adjust probabilities accordingly as these effects compound. Data compiled from 2024 through July 2026 across top-tier domestic leagues shows that home teams in sold-out stadiums convert early possession into goal-scoring opportunities at rates 12 to 15 percent above their season averages. In-play markets respond by tightening odds on home win outcomes and over-total goals within the first half, while underdog lines for away sides drift outward. Observers note that lower utilization below 70 percent produces slower adjustments because the reduced atmosphere allows visiting players to maintain tactical structures more effectively.
Bookmakers incorporate real-time attendance figures into their algorithms alongside traditional variables such as current scoreline, time elapsed, and player substitutions. When capacity utilization exceeds standard thresholds, automated systems trigger wider initial price movements to account for increased variance in expected outcomes. This process relies on historical datasets that quantify crowd density effects on metrics including pass completion rates, foul frequency, and disciplinary cards issued.
Regional Data Patterns and Market Responses
Analysis of attendance records paired with live odds feeds reveals distinct regional variations. Southern European leagues with traditionally vocal supporter bases demonstrate sharper in-play shifts during capacity fixtures than northern counterparts where crowd behavior tends toward more measured expressions. A study published by the University of Groningen examined over 2,400 matches and identified statistically significant correlations between occupancy rates above 85 percent and elevated home team expected goals values in the second half. Those findings align with observations from Australian sports analytics groups that track similar dynamics in A-League encounters.
Platforms adjust liquidity provision when utilization data indicates potential for rapid momentum changes, and traders monitor social media sentiment from inside venues to anticipate further movements. External factors such as weather conditions that reduce effective capacity through empty sections can offset some crowd influence, yet full houses still dominate the statistical relationship.
Practical Implications for Market Participants
Those monitoring in-play activity often cross-reference official attendance reports released shortly after kickoff with live odds feeds to identify early discrepancies. When utilization reaches near-maximum levels, the probability of late-game comebacks by home sides increases measurably according to aggregated performance databases, prompting corresponding price compressions on draw and home-draw-double-chance selections. Lower capacity games meanwhile maintain steadier lines because reduced external stimuli allow teams to execute pre-match strategies with greater consistency.
Industry reports from the European Sports Betting Association highlight how operators refine their models seasonally by incorporating updated attendance trends, especially following major tournament periods when venue configurations change. Data through mid-2026 shows continued refinement of these inputs as more granular tracking becomes available through stadium sensor systems.
Conclusion
Stadium capacity utilization functions as a measurable input that shapes the velocity and direction of in-play odds adjustments during crowded fixtures. Research from academic and industry sources demonstrates consistent patterns across leagues where higher occupancy amplifies home advantage indicators and accelerates market responses. Market participants who integrate attendance metrics with traditional performance data gain access to additional context for interpreting live price movements, while operators continue updating models to reflect evolving venue dynamics observed through July 2026 and beyond.