Referee Travel Mapping and Its Influence on Spread Adjustments
Written by Greta Friedrich · Jun 2, 2026

Referee Travel Mapping and Its Influence on Spread Adjustments
Travel patterns for officials have become a measurable input in models that refine spread calculations, particularly in leagues where schedules stretch across wide geographic areas, and analysts track these routes because cumulative distance and recovery windows correlate with performance variations that betting lines must account for. Data collection on these movements expanded notably by June 2026 as leagues adopted integrated tracking systems that feed directly into probabilistic forecasting tools used by operators and oddsmakers.
Core Elements of Route Mapping Systems
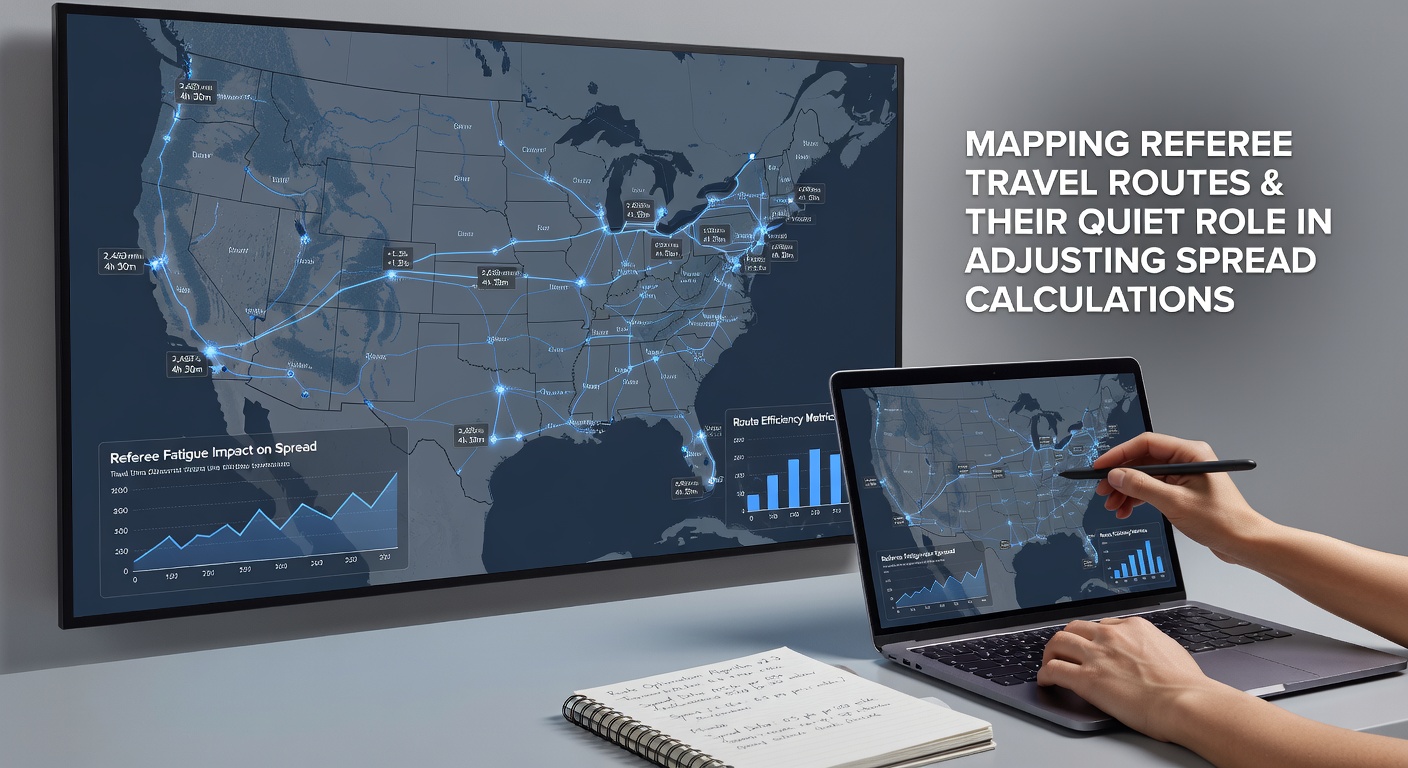
Mapping begins with GPS logs, flight records, and venue schedules that together create a timeline for each referee or umpire, while software layers in variables such as time zone changes, total kilometers traveled in the preceding 72 hours, and rest intervals between assignments. These datasets allow algorithms to assign fatigue scores that adjust expected performance baselines before spreads are finalized, and several professional organizations now share anonymized versions of this information with analytics partners under controlled agreements. Observers note that the process mirrors fatigue monitoring already common in player workload management, yet it remains less publicized because it operates behind the scenes in line-setting workflows rather than in public performance reports.
Integration Into Spread Calculation Models
Once fatigue scores are generated they enter regression models alongside traditional factors like home advantage, recent form, and weather, where the travel variable receives a weighted coefficient that shifts the projected margin by fractions of a point or goal depending on the sport. Research from academic institutions shows that referees covering distances exceeding 800 kilometers within three days exhibit measurable declines in decision accuracy during high-intensity periods, and these findings translate into small but consistent tweaks to opening spreads. Operators in North America and Australia have incorporated similar variables into their proprietary systems, drawing on data standards developed by bodies such as the Australian Gambling Research Centre that emphasize transparent methodology for workload-related adjustments.
League-Specific Applications and Data Patterns
In North American major leagues the cross-country flights common during condensed schedules produce the clearest signals, whereas European domestic competitions see smaller effects because distances remain modest yet cumulative weekly travel still registers in multi-week models. One documented approach involves layering referee assignments onto fixture lists weeks in advance so that any clustering of long-haul trips triggers an automated flag for review, and this practice gained wider adoption after 2025 schedule releases highlighted several high-travel clusters. Figures from industry reports indicate that spread movements attributed partly to travel data average between 0.2 and 0.8 points in basketball and hockey, while soccer models register goal-line shifts closer to 0.1 goals when recovery windows fall below 48 hours.
Technological Tools and Data Sources
Commercial platforms combine public flight databases with league-provided assignment sheets to generate the underlying maps, and machine-learning layers then predict how similar past travel profiles affected outcomes. Partnerships with research groups at institutions such as those publishing through the National Institutes of Health archive supply peer-reviewed benchmarks on cognitive performance under travel stress that refine the weighting of each variable. These tools operate continuously, updating scores as new assignments are confirmed and allowing oddsmakers to recalibrate spreads closer to kickoff when last-minute travel changes occur.
Future Developments in Travel-Informed Modeling
Expansion of wearable technology for officials is expected to add heart-rate variability and sleep data to existing distance metrics, creating higher-resolution inputs for teh same spread-adjustment frameworks. Leagues continue to test real-time dashboards that would let supervisors balance assignments more evenly, indirectly influencing the magnitude of travel-related line movements. As datasets grow through the 2026 season, the precision of these quiet adjustments is likely to increase without altering the public presentation of spreads themselves.
Conclusion
Route mapping for referees supplies one additional data stream that operators fold into established forecasting routines, and the resulting spread refinements remain small yet systematic across multiple sports. Continued collection of travel and performance metrics supports incremental improvements in model accuracy while staying embedded within broader analytical processes that already handle dozens of variables.