Recovery Time Patterns Across Football Leagues Shape Accumulator Planning
Written by Taylor Brooks · Aug 23, 2026
Recovery Time Patterns Across Football Leagues Shape Accumulator Planning
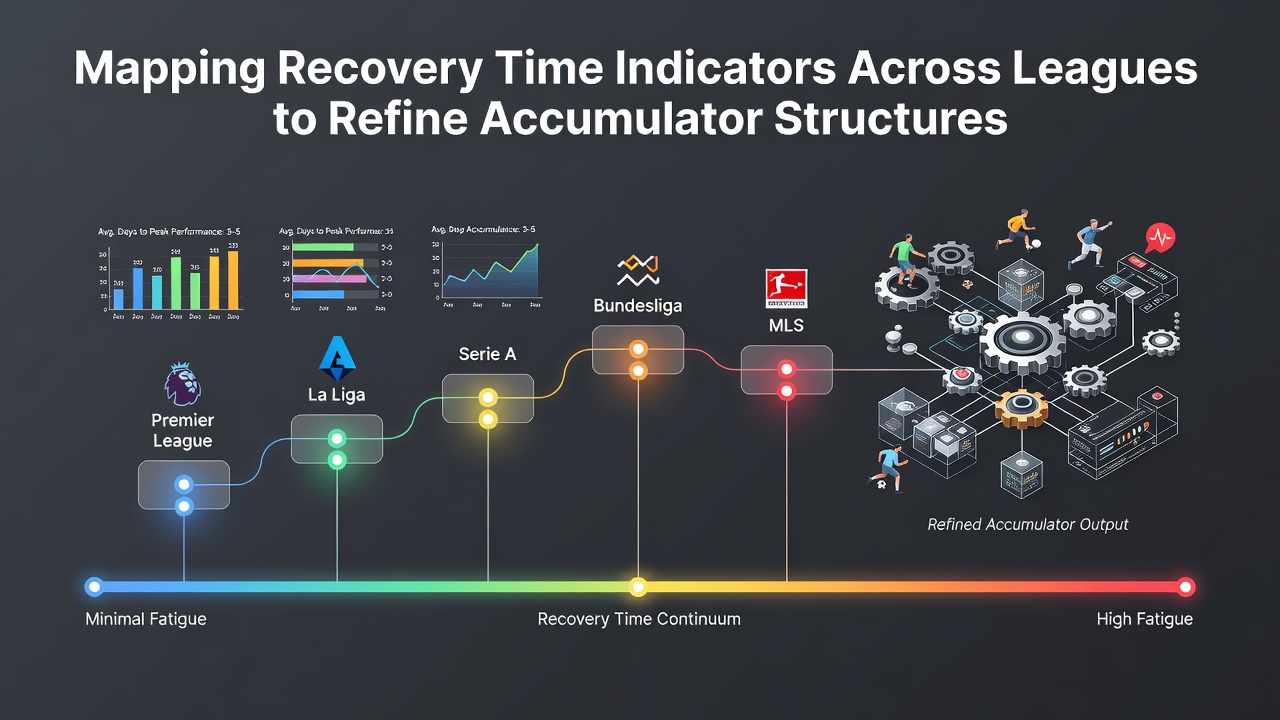
Football schedules create distinct recovery windows that differ sharply between competitions, and analysts track these intervals to adjust accumulator selections accordingly. Data from league calendars in August 2026 shows the Premier League averaging 3.8 days between fixtures for most clubs, while the Bundesliga stretches some gaps to 4.5 days during the same period. These differences matter because shorter recovery correlates with measurable drops in sprint distance and pass completion rates according to performance databases maintained by Opta.
League Schedules Create Measurable Recovery Gaps
Observers note that Serie A clubs often face back-to-back fixtures separated by only 72 hours when Coppa Italia ties overlap with league rounds, whereas Ligue 1 maintains slightly longer rest periods through careful fixture clustering. Researchers at the University of Barcelona compiled match-interval statistics across five major leagues and found that La Liga teams receive the highest average rest at 4.2 days, followed by the Bundesliga. Teams with fewer than three full days between games show a 12 percent reduction in high-intensity running output in the subsequent match, a figure drawn from GPS tracking systems used by professional clubs.
Linking Recovery Data to Accumulator Construction
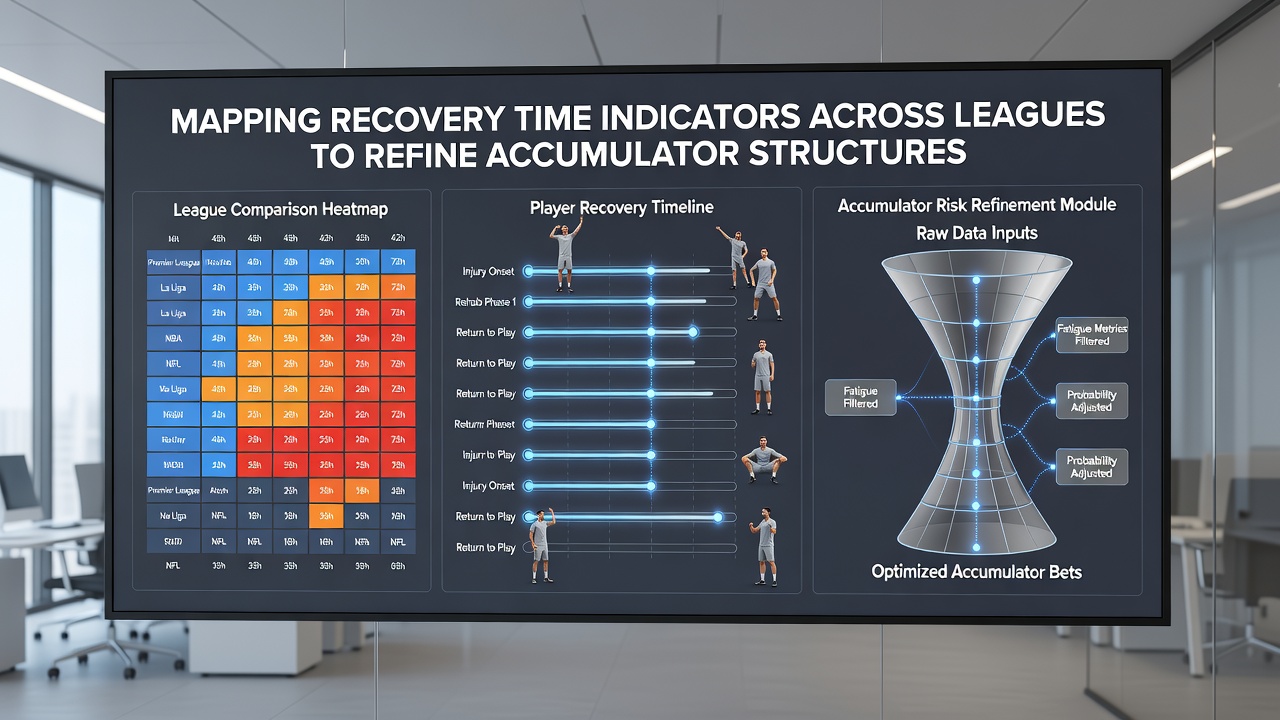
Accumulator builders examine these recovery metrics when stacking multiple selections because fatigue influences both over and under markets as well as team totals. One study released by the German Football League tracked 1,240 matches and determined that sides returning from midweek European ties win 8 percent fewer away games in the following weekend round. Bettors therefore adjust stake distribution when an accumulator includes teams playing on short rest, shifting weight toward selections where the opponent also faces limited preparation time. This approach relies on public schedule data rather than proprietary models.
Travel and Congestion Add Layers to Recovery Calculations
Long-haul travel compounds the effects of short recovery windows, particularly for clubs competing in multiple competitions. Australian Sports Commission reports on elite athletes indicate that crossing multiple time zones reduces neuromuscular function for up to 72 hours, a finding applied by European analysts monitoring Champions League participants. In August 2026, several Premier League sides traveled to North America for pre-season tournaments before returning for domestic openers, creating documented spikes in soft-tissue injuries during the first month of the campaign. Accumulator structures that ignore travel distance therefore overlook a variable shown to affect both goal timing and defensive errors.
Practical Mapping Techniques Used by Analysts
Analysts build simple matrices that list each team's cumulative recovery days across a four-week window, then cross-reference those totals with historical performance splits. UEFA technical reports provide the raw fixture lists that feed these matrices, allowing consistent comparison across borders. Teams averaging under 3.5 days of rest in that window produce 0.3 fewer expected goals per game than their season average, according to aggregated event data. This quantitative layer lets accumulators incorporate recovery thresholds rather than relying solely on recent form or head-to-head records.
Examples from Recent Seasons
During the 2025-2026 campaign, clubs that played four matches in 14 days recorded a 15 percent increase in yellow cards issued to their defenders, a pattern visible in official disciplinary statistics. Accumulator users who mapped this trend avoided selections involving those sides in low-scoring markets. Similar patterns appear when mid-season international breaks end and domestic leagues resume, because recovery time for returning players varies by national-team travel commitments tracked through FIFA scheduling documents.
Conclusion
Recovery time indicators supply an objective input for accumulator refinement when integrated with league-specific schedules and performance datasets. Mapping these intervals across competitions reveals consistent patterns that influence match outcomes, and analysts continue to refine the approach using publicly available fixture information and standardized performance metrics.