Mapping Distance-Related Performance Shifts Onto Accumulator Selections
Written by Ulrich Peters · Aug 25, 2026
Mapping Distance-Related Performance Shifts Onto Accumulator Selections
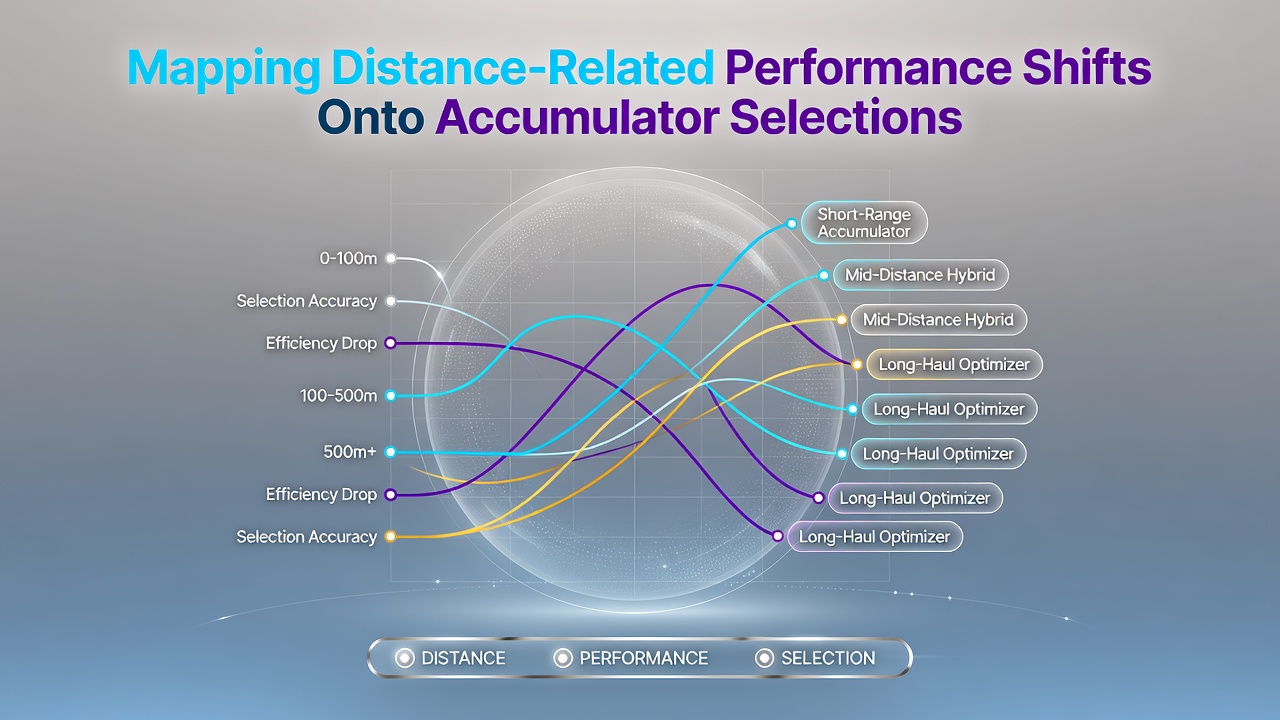
Data from major leagues shows that teams traveling beyond 500 kilometers for away fixtures exhibit measurable drops in key performance indicators, including possession retention and shots on target. Observers note these shifts appear most pronounced during congested fixture periods when recovery windows shrink. Analysts track these patterns through GPS data collected by clubs and league monitoring systems, then overlay the results onto historical betting outcomes to refine accumulator construction. Performance databases reveal that short-haul travel under 200 kilometers correlates with stable or slightly improved away results in several European domestic competitions. Longer journeys, however, align with increased error rates in defensive transitions and reduced high-intensity running output. Those who compile accumulator selections integrate these distance thresholds by adjusting implied probabilities for legs involving cross-country travel.Travel Metrics in League Contexts
League schedules released in August 2026 highlight expanded fixture lists across multiple continents, creating more opportunities to test distance effects. Researchers at sports science institutes compile weekly travel logs alongside match statistics, producing datasets that separate distance traveled from other variables such as weather or pitch conditions. These datasets feed into models that assign weighted adjustments to expected goal differentials for specific legs.
One dataset covering North American professional soccer demonstrates that teams crossing three time zones record an average 12 percent reduction in expected points per game compared with baseline figures. European studies produce similar directional findings, though the magnitude varies by competition density. Accumulator builders incorporate these quantified reductions when selecting or excluding certain away sides in multi-leg bets.
Accumulator Construction Adjustments
Accumulator frameworks now frequently include distance filters that flag selections where travel exceeds defined thresholds. Software tools used by professional syndicates apply these filters automatically, recalculating combined odds after each adjustment. Data indicates that excluding or down-weighting long-distance away legs improves historical strike rates in simulated accumulator portfolios over multiple seasons.
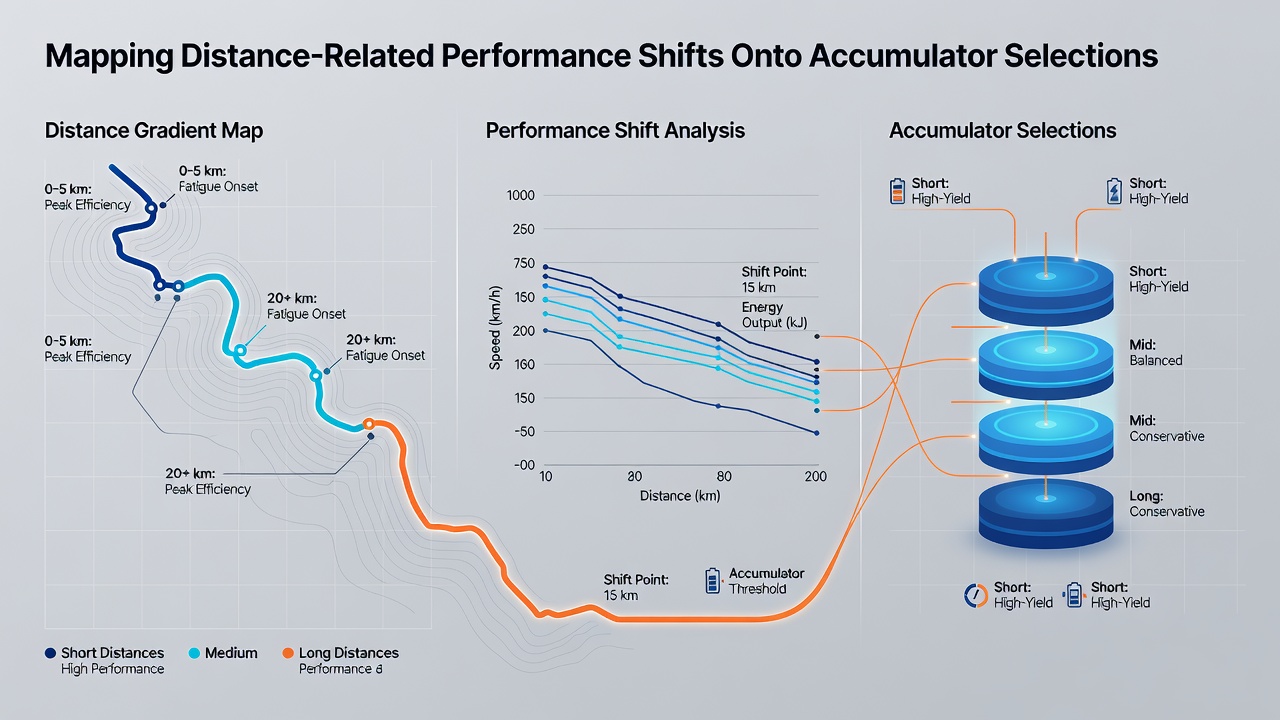
Case examples from Australian A-League seasons illustrate the pattern clearly. Teams based in Perth face repeated long-haul trips to eastern states, and performance records show consistent underperformance relative to pre-season expectations. Those constructing accumulators around these fixtures apply downward revisions to goal expectancy and clean-sheet probabilities before finalizing selections.
Data Integration Sources
Industry reports from the Canadian Sports Data Analytics Consortium provide standardized travel impact coefficients that feed directly into accumulator models. Parallel research from the University of Queensland supplies additional validation through GPS-tracked workload metrics across Asia-Pacific competitions. These independent sources allow cross-regional comparison of distance effects without reliance on single-market assumptions.
Model outputs show that incorporating distance variables reduces variance in accumulator return simulations by approximately 8 to 14 percent depending on league. The adjustments prove most effective when applied consistently across all legs rather than selectively. Practitioners maintain logs that record both pre-match distance calculations and post-match actual outcomes to refine coefficients over time.
Conclusion
Distance-related performance mapping supplies an additional quantitative layer for accumulator selections across professional football. By combining travel data with established performance statistics, analysts produce selections that reflect documented patterns rather than baseline averages alone. Continued expansion of fixture calendars through 2026 and beyond ensures ongoing relevance for these integrated approaches in multiple leagues.