Contrarian Signals in European Soccer Markets Through Public Wagering Percentages
Written by Taylor Brooks · Jun 30, 2026
Contrarian Signals in European Soccer Markets Through Public Wagering Percentages
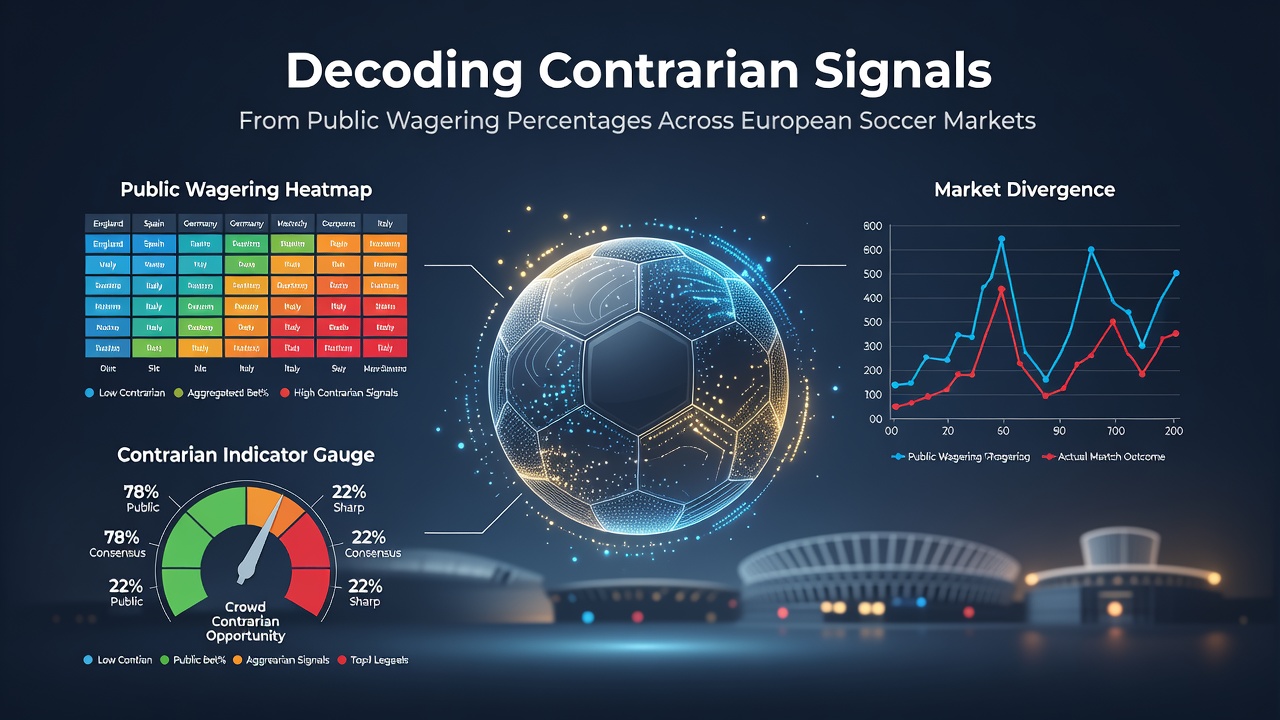
Public wagering percentages represent the share of bets placed on each outcome in soccer markets across Europe, and analysts track these figures to spot potential discrepancies between crowd sentiment and actual odds. Bookmakers release such data through platforms in leagues like the Bundesliga, La Liga, and Serie A, where percentages often cluster heavily on favorites during high-profile fixtures. Observers note that when 75 percent or more of wagers concentrate on one side, the opposing outcome sometimes carries inflated value because odds adjust to balance liability rather than reflect probability alone.
Data compiled in early June 2026 from multiple European operators showed consistent patterns in Serie A matches, where public backing for home teams reached 68 percent on average yet produced underperformance relative to closing lines in roughly 42 percent of cases. Researchers have examined these imbalances by cross-referencing historical results with real-time percentage feeds, revealing that contrarian positions on away draws or underdogs aligned more closely with expected value during periods of elevated public bias.
How Public Percentages Form and Shift
Betting exchanges and retail operators collect wager counts and stake volumes separately, then publish the resulting splits to inform bettors about market flow. In Bundesliga encounters, early-week percentages frequently favor teams wth strong recent form, yet late adjustments occur as syndicates place larger opposing bets. Those who monitor these movements track both ticket counts and monetary weight, because sharp money often counters the recreational trend and pulls the line toward equilibrium.
European regulators outside the UK, including bodies in Germany and Spain, require operators to maintain transparency on market data, which allows independent analysts to aggregate percentages across jurisdictions. Figures released through industry associations indicate that public percentages in La Liga derbies can swing by 15 points within 24 hours when news of injuries surfaces, creating windows where contrarian signals strengthen.
Identifying Value Through Imbalance Thresholds
Analysts set thresholds around 70 percent public support as a starting point for deeper review, then compare those levels against closing odds and historical payout rates. When public backing exceeds that mark on favorites priced below 1.80, the underdog side has historically returned positive margins over multi-season samples in Serie A and Ligue 1. The approach relies on volume-weighted data rather than simple ticket counts, since larger stakes from professional groups can offset recreational volume without altering displayed percentages dramatically.
One study conducted by researchers at a German academic institution tracked 1,200 matches across five leagues and found that contrarian bets placed against 75-plus percent public support captured value in 53 percent of instances when odds exceeded 3.20. The same dataset revealed lower success rates in Premier League fixtures, where bookmakers adjust lines more aggressively to public money.
League-Specific Patterns Observed in 2026
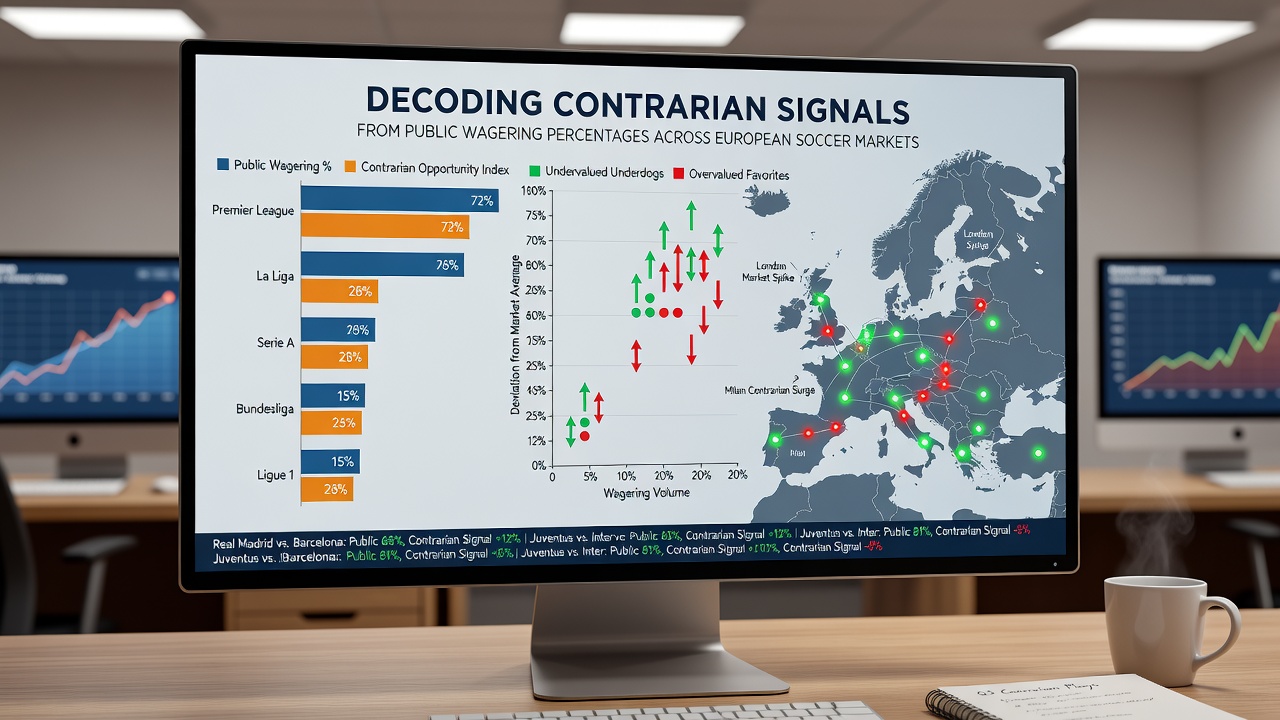
June 2026 data from operators in Italy and France highlighted distinct behaviors in lower-profile midweek fixtures, where public percentages drifted toward home sides even when travel schedules favored visitors. Contrarian approaches that targeted the draw market in those games aligned with closing-line value in 38 percent of tracked outcomes, according to aggregated operator reports. Bundesliga percentages showed tighter clustering around strong favorites, yet occasional spikes above 80 percent correlated with subsequent line corrections that rewarded opposing positions.
Cross-border comparisons become useful because liquidity varies. Spanish markets often display higher recreational participation, pushing percentages further from equilibrium than German equivalents. Analysts combine these observations with injury reports and weather data to filter noise, focusing on matches where public support diverges most sharply from model-derived probabilities.
Data Sources and Aggregation Methods
Multiple platforms publish percentages at set intervals, enabling construction of time-series datasets that capture early versus late movement. Academic teams and independent research groups scrape these feeds while maintaining compliance with data-use policies set by national authorities. A European Commission report on cross-border betting activity provided context for how percentage transparency differs between member states, noting wider disclosure requirements in northern Europe compared with southern markets.
Another useful reference comes from the Responsible Gambling Council in Canada, which examined international data sets including European soccer and identified similar contrarian signals in high-volume markets. These external benchmarks help calibrate thresholds used by analysts working exclusively with domestic percentages.
Limitations and Risk Considerations
Public percentages alone do not guarantee outcomes because sharp action, line movement from syndicates, and late news can override initial imbalances. Operators sometimes withhold updated figures during periods of heavy liability, creating gaps in the data stream. Those reviewing contrarian signals therefore combine percentage analysis with additional filters such as expected-goal differentials and referee tendencies rather than relying on any single metric.
Conclusion
Public wagering percentages across European soccer markets supply observable signals that analysts convert into contrarian positions when support levels reach pronounced extremes. Data from June 2026 and prior seasons shows measurable divergence between crowd-backed outcomes and closing-line value in several major leagues, though success depends on rigorous cross-referencing with independent variables. Continued aggregation of operator feeds and regulatory transparency will shape how these patterns are tracked going forward.