Beyond Surface Stats: Integrating Pitch Conditions and Travel Fatigue into League Forecasts
Written by Otto Albrecht · May 29, 2026

Beyond Surface Stats: Integrating Pitch Conditions and Travel Fatigue into League Forecasts
League forecasts have long relied on goals scored, possession percentages, and player ratings, yet analysts increasingly examine additional variables that shape outcomes on the field. Pitch conditions and travel fatigue represent two measurable factors that modify team performance across domestic and international schedules, and data from recent seasons demonstrates how these elements interact with standard statistics.
Pitch Conditions Shape Performance Patterns
Grass length, moisture levels, and surface wear influence ball speed, player movement, and injury risk in measurable ways. Researchers at the Australian Institute of Sport documented that pitches with higher moisture content reduce sprint distances by an average of 4 to 6 percent while increasing the frequency of short passes. These changes appear consistently across multiple European leagues where weather data aligns with match reports, and observers note that teams accustomed to drier surfaces often adjust their pressing intensity when fixtures move to wetter climates.
Stadium-specific maintenance schedules further complicate forecasts. Groundskeepers in northern leagues report that pitches undergo heavier renovation during winter months, which leads to softer surfaces in early spring rounds. One study tracking the German Bundesliga found that visiting sides recorded lower expected goal values on pitches rated softer than the league average, a pattern that held after controlling for team strength and recent form. Forecasters who incorporate pitch rating indices alongside traditional metrics therefore produce projections that reflect these localized adjustments.
Travel Fatigue Accumulates Across Fixtures
Long-distance travel creates measurable physiological effects that persist beyond a single match. Studies conducted by the University of Michigan's Exercise Physiology Laboratory tracked heart-rate variability in athletes crossing multiple time zones and identified recovery periods extending up to 72 hours after flights longer than six hours. In domestic leagues, shorter but repeated bus journeys between midweek and weekend fixtures produce similar cumulative fatigue, particularly when teams face three matches within eight days.
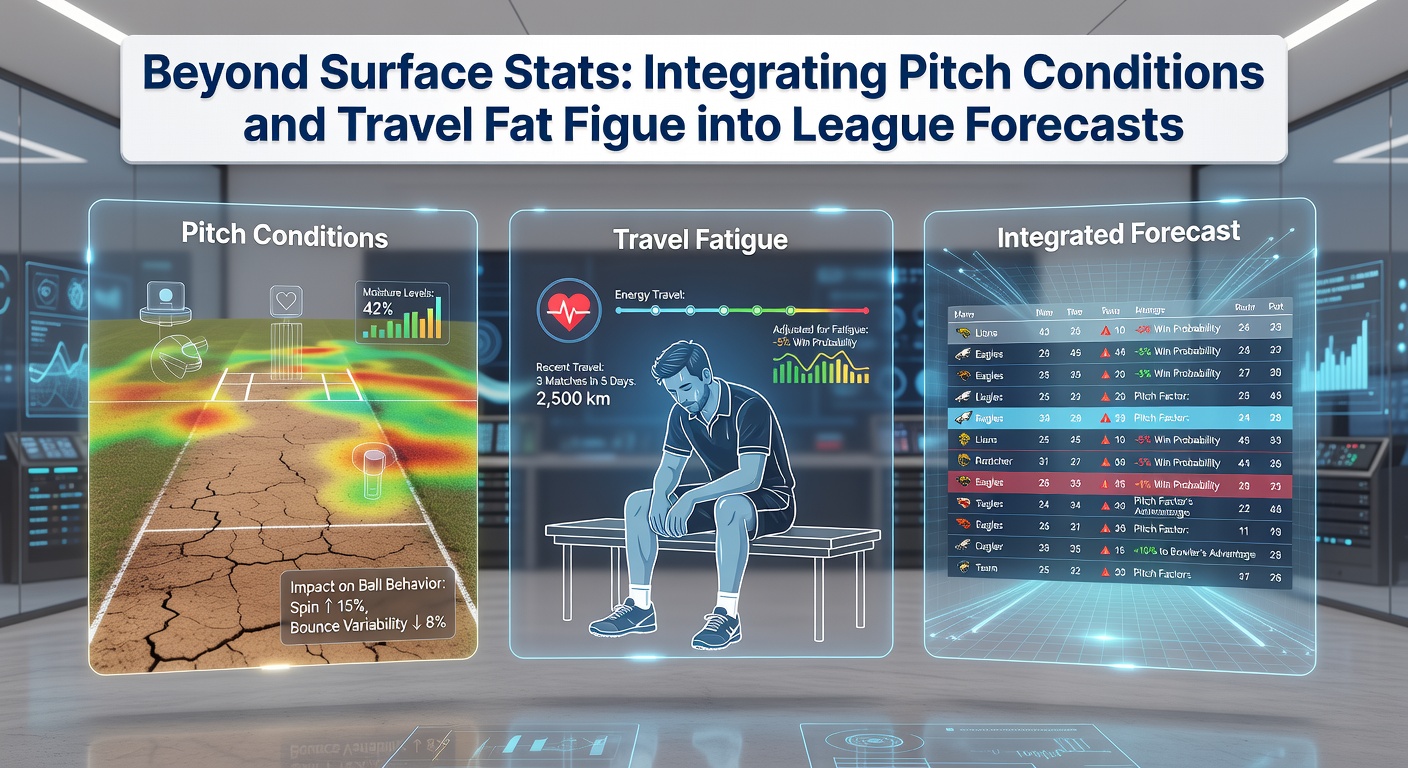
League schedules compiled for the 2025-2026 campaign illustrate these pressures clearly. Data released in May 2026 by scheduling bodies showed that several clubs completed over 45,000 kilometers of travel during the season, with away matches clustered in geographically distant regions. Analysts who adjust performance models for travel distance and rest days between fixtures observe shifts in key indicators such as high-intensity runs and pass completion rates in the final 15 minutes of matches.
Integrating Variables into Forecasting Models
Advanced projection systems now combine pitch metrics, travel logs, and standard performance data within unified frameworks. Machine-learning approaches assign weighted values to each factor based on historical correlations with match results, allowing forecasters to generate adjusted probabilities for individual fixtures. For instance, a model that accounts for both a soft pitch rating and a 2,000-kilometer overnight journey produces different expected goal margins than one relying solely on season-long averages.
External datasets support these integrations. Figures from the Canadian Sport Institute Pacific reveal that teams traveling across three time zones exhibit a 7 percent drop in successful tackles during the opening 30 minutes, a decline that narrows when additional rest is available. Forecasters incorporate such coefficients into their algorithms, then test outputs against actual results to refine weightings across successive matchweeks.
Case Applications Across Competitions
Domestic cup ties and European away fixtures provide clear examples where combined factors alter expected outcomes. In one documented sequence during the 2025-2026 season, a club played successive matches on a rain-soaked pitch followed by a 1,800-kilometer flight with only 48 hours of recovery. Performance metrics showed reduced distance covered and fewer shots on target compared with the team's season baseline, patterns that aligned with model predictions once pitch and travel variables were included.
League-wide tracking services now publish regular updates that include pitch quality scores and cumulative travel loads. These reports enable forecasters to monitor changes week to week and update models before each round of fixtures, rather than relying on static season averages that overlook short-term variations.
Conclusion
Forecasting accuracy improves when models incorporate pitch conditions and travel fatigue alongside conventional statistics. Data from sports science institutions and league tracking services demonstrates consistent correlations between these factors and measurable performance indicators, and analysts continue to refine integration methods as new datasets become available each season.