Analyzing Margin Variations: Systematic Odds Comparison Methods in Modern Betting Markets
Written by Greta Friedrich · Aug 4, 2026

Analyzing Margin Variations: Systematic Odds Comparison Methods in Modern Betting Markets
Bookmaker margins, often called overrounds, represent the built-in advantage that pricing structures embed into every market. Observers note these percentages typically range between 2 and 5 percent for major football fixtures, though figures climb higher in less liquid events. Systematic comparison begins with converting each set of odds into implied probabilities, summing those values, and subtracting 100 percent to isolate the margin itself. Data from regulatory filings in Nevada and Victoria reveal consistent patterns where leading operators maintain tighter margins on high-volume leagues while expanding them elsewhere.
Calculating Overrounds Across Providers
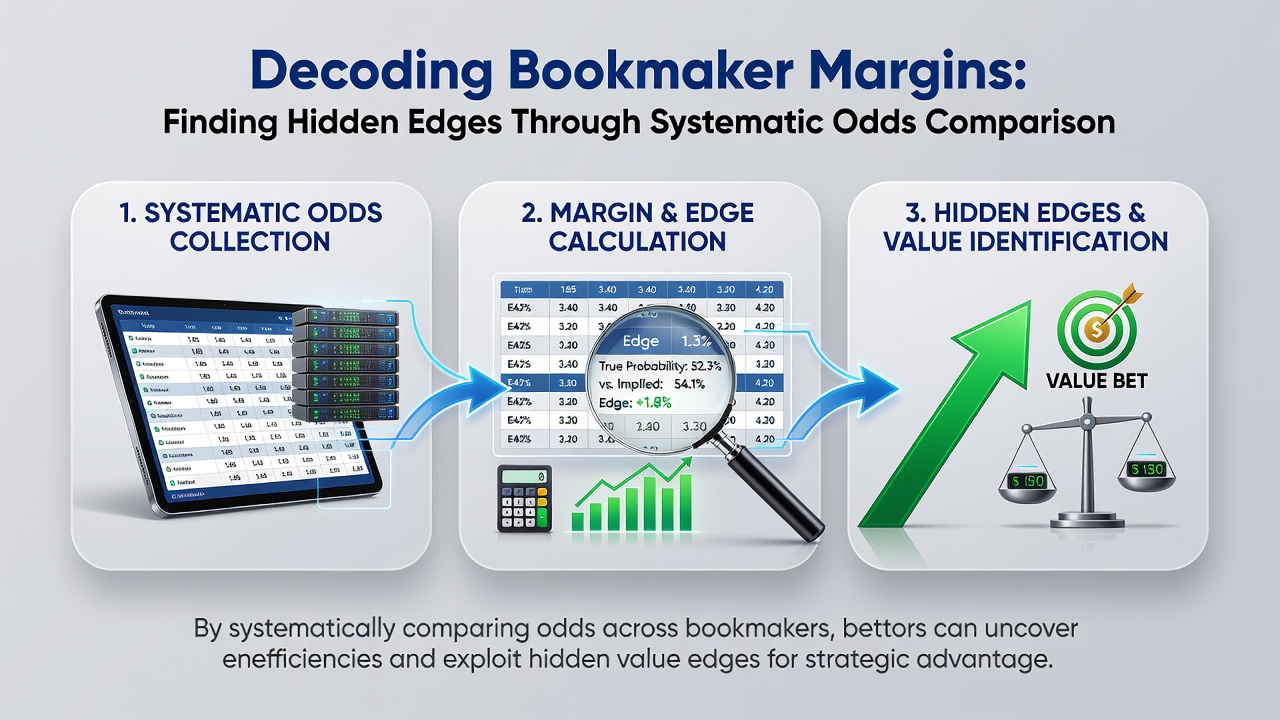
Researchers at several academic centers have outlined straightforward formulas that convert decimal odds into probabilities by taking the reciprocal of each price. When multiple bookmakers quote the same outcome, those probabilities get added together and then compared against 100 percent. The resulting figure quantifies the collective margin. Analysts frequently repeat this process across dozens of fixtures in a single session, creating datasets that highlight which operators consistently price closer to true probability. Figures released by the Nevada Gaming Control Board in mid-2026 show average football margins narrowing by 0.4 percentage points year-over-year in regulated markets.
Building a Comparison Framework
Those who study betting markets describe frameworks that pull live odds from multiple platforms into a single spreadsheet or database. Automated scripts refresh prices every few minutes, recalculate margins, and flag instances where one provider deviates significantly from the group average. Such deviations sometimes signal temporary mispricing that disappears within minutes. Industry reports compiled by the Australian Gambling Research Centre indicate that systematic scanners operating during the 2025-2026 season captured average margin differences of 1.8 percent between the tightest and loosest quotes on Premier League matches.
Regional Variations and August 2026 Trends
Market data collected through the first weeks of August 2026 demonstrate that European operators tightened margins on major domestic leagues ahead of the new season, while some offshore platforms maintained wider spreads. Comparative analysis across jurisdictions shows that operators licensed in multiple territories often adjust pricing to comply with local tax regimes, producing noticeable differences in the same match. Observers tracking these shifts compile weekly reports that rank providers by average overround, allowing systematic comparison without relying on any single source.
Practical Application of Margin Data
Traders and analysts apply margin rankings when deciding where to place larger stakes, concentrating activity with operators whose prices sit closer to the lowest observed overround. This approach does not guarantee outcomes but reduces the structural cost embedded in each bet. Studies published by the International Centre for Gaming Regulation document that bettors who consistently select the lowest-margin quotes across a season achieve a measurable reduction in cumulative costs compared with random selection. The same research notes that margin differentials widen during live betting windows, creating additional opportunities for those monitoring multiple feeds simultaneously.
Limitations and Data Quality Considerations
Systematic comparison depends on accurate, timely odds feeds. Delays or incomplete data can distort margin calculations and produce misleading rankings. Regulators in several jurisdictions now require operators to publish historical odds data, improving transparency for independent analysts. Reports from teh Canadian Centre on Substance Use and Addiction highlight that public access to granular pricing information remains uneven across provinces, affecting the reliability of cross-border comparisons. Those compiling long-term datasets therefore apply strict filters to exclude stale quotes and verify each source before inclusion.
Conclusion
Systematic odds comparison provides a structured method for quantifying bookmaker margins and identifying pricing discrepancies across providers. Data from multiple regulatory and academic sources demonstrate measurable variation in overrounds both within and between markets. Analysts who maintain consistent comparison protocols can track these differences over time, though results depend on data quality and the speed of market updates. Ongoing regulatory developments in several regions continue to shape the availability and granularity of pricing information available for such analysis.